The Yield Trap: Why FTSE 100 Income Numbers Deserve More Scepticism in 2026
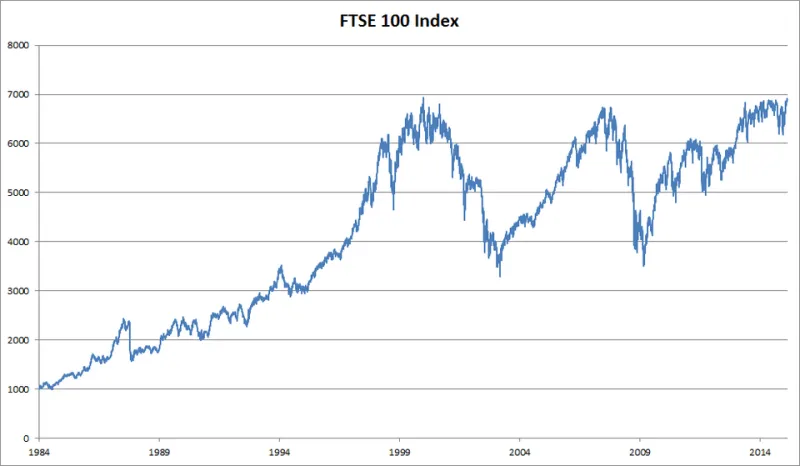
Photo: Thrapper, CC BY-SA 3.0, via Wikimedia Commons
A yield of 7% on a large-cap UK name reads like a commitment. It is not. It is arithmetic: dividend per share divided by price. Which means it rises when the share price falls, and it rises most when the market has begun to doubt the dividend altogether. The highest yields on the index are frequently not the market's most generous companies but its most contested ones. For anyone building an income book, that inversion is the whole problem.
A Yield Is a Question, Not an Answer
When a stock yields twice the index average, the market is asking something. Is the payout covered? Is the balance sheet strong enough to fund it through a downturn? Is the sector facing a structural headwind that management is papering over with a progressive dividend policy? A yield screen answers none of these. It simply sorts companies by how cheap the market thinks the income is — and cheap and mispriced are not synonyms.
The practical consequence is that yield-led portfolios drift towards terminal risk. That is not a moral failing of the screen; it is what the screen is designed to do.
The Buyback Illusion
Buybacks have quietly rewritten the income landscape. When a company repurchases its own shares, the share count falls, earnings per share rise, and a flat dividend per share suddenly looks better covered than it did a year earlier. Nothing about the cash returned to shareholders has changed — only the denominator.
The distortion cuts both ways. A business that returns £1bn through buybacks rather than dividends shows a lower headline yield than an identical business paying it out as income, even though total shareholder return is the same before tax. Screens built purely on dividend yield systematically under-weight the buyback-heavy compounders — several of the large banks, energy majors and index heavyweights have leaned this way — and over-weight the payout-maximisers who have nothing left for reinvestment.
The fix is simple and rarely applied: calculate total shareholder yield, adding buybacks to the dividend and dividing by market capitalisation. Then ask whether the buyback is funded by free cash flow or by debt. A repurchase programme financed by borrowing is not a return of capital; it is a re-leveraging with better public relations.
Currency: The Cost Nobody Prices
Roughly three-quarters of FTSE 100 revenue is generated outside the UK. That means the sterling dividend you receive is a translated number, and translation cuts both ways. A weaker pound flatters reported dividends from dollar and euro earners; a stronger pound does the opposite, and can turn a growing payout into a shrinking one without a single decision being taken in the boardroom.
Several years of soft sterling have rewarded unhedged income investors by accident. Accidents are not a strategy. Hedging is available, but it is priced: forward points reflect the interest rate differential, so a hedged share class can surrender one to two percentage points of yield a year when UK rates sit below US rates. An ETF that hedges monthly also carries roll costs and tracking drag that rarely appear in the marketing yield.
The honest approach is to state the currency assumption explicitly. If your income forecast depends on sterling staying weak, say so — and then model what happens if it strengthens 8%.
Payout Cover Is the Only Number That Matters
Dividend cover is earnings per share divided by dividend per share. Below 1.5× and the board has little room to absorb a bad year. Below 1.2× and the dividend is not a policy but a decision, taken annually, under pressure.
For capital-intensive sectors, cash cover matters more than earnings cover: free cash flow after maintenance capex, divided by the cash cost of the dividend. Add three further checks — net debt to EBITDA above 2.5×, a refinancing wall inside 24 months, and pension deficit contributions that quietly rank ahead of shareholders — and most fragile payouts identify themselves before the cut.
Two further traps deserve naming. First, special dividends should never be capitalised into a yield; annualising a one-off is a category error that flatters the figure by a third or more. Second, scrip alternatives and dividend reinvestment plans can mask the fact that a company is conserving cash, because the headline payout is unchanged while the share count grows.
Sector Concentration: One Bet in Ten Costumes
FTSE 100 income is concentrated. Banks, energy, mining, tobacco and utilities account for a disproportionate share of the index's distributed cash, and they cluster precisely where terminal risk clusters: the credit cycle, the commodity cycle, regulation, and the energy transition.
A ten-stock income portfolio drawn from those sectors is not diversified. It is a single leveraged bet on a benign macro path, dressed as ten separate decisions. Run the arithmetic: if half your income comes from three sectors, your portfolio's cash flow is a sector call, and you should size it as one.
A Sapphire Checklist for Durable Income
- Cover: earnings cover at or above 1.5× and free cash flow cover at or above 1.2×.
- Leverage: net debt to EBITDA below 2.5×, with no refinancing wall inside 24 months.
- Cash, not paper: the dividend is paid in cash, not predominantly in scrip.
- Currency: state the share of revenue that is non-sterling and whether the yield is translation-flattered.
- Total shareholder yield: add buybacks to the dividend and check how they are funded.
- Cycle test: did this payout survive the last downturn, or was it cut, suspended or rebased?
- Concentration: no single sector contributing more than 25% of portfolio income.
- Opportunity cost: if the yield is below the ten-year gilt, what exactly are you being paid for the equity risk?
- Stress it: model a 20% dividend cut and re-examine whether the position still earns its place.
- Policy versus promise: read the dividend policy language for the word 'progressive' — and check whether it is.
The Bottom Line
Total return is dividends plus price change, minus dealing costs, minus the tax that applies outside a tax wrapper. A 6% yield attached to a 9% price decline is not income; it is a 3% loss with a pleasant narrative. Yield is a hypothesis about the future, priced by people who may be wrong in either direction. Treat it as a question to be interrogated, not a figure to be collected — and the difference between durable income and a value trap becomes visible while there is still time to act on it.