The Index That Isn't: Decomposing the FTSE 100's Hidden Sector and Sterling Wagers

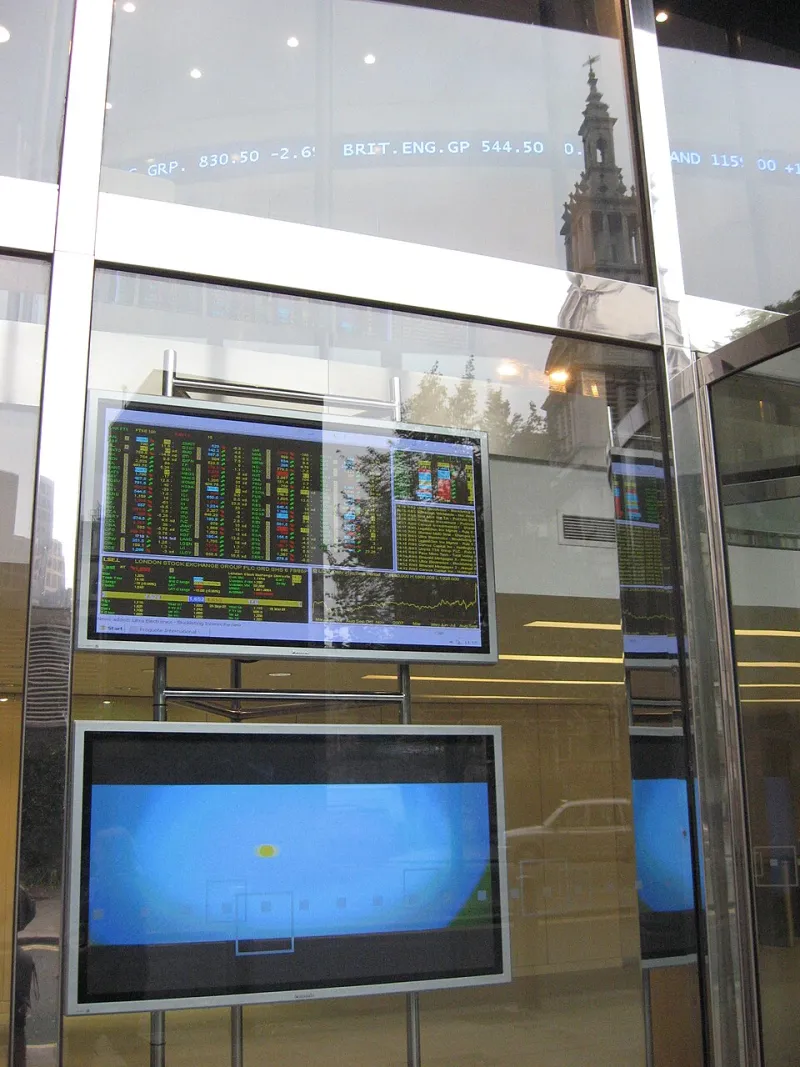
Photo: Colin, CC BY-SA 4.0, via Wikimedia Commons
A benchmark with a concentrated core
The FTSE 100 occupies an unusual position in the minds of UK investors. It is quoted on every bulletin, tracked by the largest domestic index funds, and treated in casual conversation as the market. That shorthand conceals a structural fact: the index is free-float weighted, and its largest constituents are so large that a handful of names routinely account for upwards of two-fifths of total index weight.
Concentration of that order changes the character of the benchmark. A single guidance revision from a pharmaceutical major, a shift in the oil price or a decision in a Hong Kong boardroom can move the index more than the collective performance of eighty smaller members. The number on the screen is not an average of British business; it is a weighted verdict on a small group of globally orientated companies.
Four exposures wearing one label
The sector composition is the first layer of the illusion. Energy majors, the large banks and insurers, consumer staples and healthcare together commonly represent more than half of index weight, with mining adding a further cyclical tilt. Each of those clusters carries its own drivers — crude and gas prices, net interest margins and credit conditions, emerging market consumption, drug pipelines and patent cliffs, industrial metals demand — and none of them is particularly sensitive to the health of the UK domestic economy.
This matters for anyone constructing a portfolio. Buying the index is not a neutral, diversified allocation to British equities; it is a deliberate overweight to a specific set of global sectors, several of which are structurally out of favour or structurally crowded depending on the cycle. Two investors can both claim a FTSE 100 allocation and end up with materially different risk profiles depending on whether they also hold bank shares, energy funds or global staples names elsewhere in the portfolio.
The sterling switch
The second layer is currency. The widely quoted figure is that roughly three-quarters of FTSE 100 revenues are generated outside the UK, and while the precise number drifts with commodity prices and reporting changes, the direction is not in doubt. The consequence is mechanical: when sterling weakens, overseas earnings translate into more pounds, and index-level earnings estimates rise without a single underlying business improving. When sterling strengthens, the reverse applies.
In practice this makes the index behave like a portfolio with a structural short-sterling tilt. That can be useful. In periods of risk aversion, when the pound typically softens, the index often outperforms the more domestically exposed FTSE 250 and acts as a partial ballast for a UK-based investor. But it also means that anyone buying the FTSE 100 for exposure to UK growth is simultaneously taking a currency view they may never have intended to express, and one that is difficult to unwind without shorting the index outright.
The subtlety is that translation effects are not the same as economic effects. A weaker pound flatters reported earnings for a dollar earner with no UK cost base, but it squeezes the margins of a domestic manufacturer with imported inputs. Treating the two as interchangeable is where many macro narratives go wrong.
Why the illusion survives
Three forces keep the misperception alive. The first is arithmetic framing: a hundred constituents sounds like diversification, and the headline count is easier to absorb than the weight distribution underneath it. The second is home bias, which leads UK investors to reach for the most familiar large-cap benchmark rather than the one that best matches their intended exposure. The third is marketing convention, in which low-cost passive products tracking the index are presented as a default rather than as a specific sector bet.
Add a heavy dividend yield — a genuine attraction for income-focused portfolios but also a symptom of sector composition — and the index acquires a reputation for safety that its underlying holdings do not necessarily justify.
A four-step look-through framework
Measuring the hidden exposure is not difficult, but it must be done deliberately.
1. Concentration audit. Record the top-ten aggregate weight and calculate the Herfindahl-Hirschman index across the constituents. The reciprocal of that figure gives the effective number of independent names. If that number is materially below the stated count, the index is more concentrated than its label suggests.
2. Sector reconciliation. Map every other holding in your portfolio against the index's sector weights. Overlap is where hidden risk accumulates: an index position plus a global financials fund plus two bank holdings is one large bet, not three diversified ideas.
3. Revenue-currency matrix. For the largest twenty constituents, note the reporting currency and the approximate revenue split by region. Aggregate the result into a rough sensitivity to GBP/USD and GBP/EUR. This need not be precise to be useful; ordering exposures correctly is most of the value.
4. Rolling sensitivity test. Regress daily index returns against percentage changes in GBP/USD over sixty and two hundred and fifty days. Compare the FTSE 100 with the FTSE 250 and the FTSE All-Share to see the domestic/global spread in real time. A consistently negative coefficient confirms the currency tilt is currently active rather than theoretical.
Reading the results honestly
If your portfolio's R-squared against the FTSE 100 is high — say above 0.8 — you own the index, whatever the fund names suggest. If your estimated sensitivity to sterling is large and negative, then your UK equity allocation is functioning as a global equity allocation with a currency overlay.
Neither outcome is inherently wrong. The error lies in not knowing which one applies. A trader hedging currency in one part of the book while unknowingly taking a short-sterling risk through a FTSE 100 position is running two offsetting trades and paying two sets of costs for the privilege.
Practical consequences
Benchmark selection should follow exposure, not familiarity. For genuine UK economic exposure, the FTSE All-Share or the mid-cap index is a better starting point. The FTSE 100 is the natural choice when what you actually want is a sterling-reported, globally earning large-cap book.
Where the currency tilt is unwanted, it can be neutralised with a hedged share class rather than by attempting to offset it with ad hoc trades. Where the sector concentration is unwanted, the right response is a deliberate allocation to the missing sectors rather than a larger position in the same crowded benchmark.
An index is a portfolio
Portfolios have factor tilts, sector bets and currency exposures whether or not their owners acknowledge them. The FTSE 100 is no exception. It is a fine instrument for one specific job, packaged in language that implies a broader mandate than it holds.
The discipline is to look through the label. Decompose the index into its concentrations, its earnings geography and its currency mechanics, then decide whether those are the exposures you intended to own. A benchmark used without that work is not diversification; it is an unexamined position.